Graph PNG | Page 2
Browse 141+ Graph PNG as free, transparent downloads
There are 141 Graph PNG to browse here. Some lean dark and moody; others are bright enough for a daytime desk. Composite them without cutting anything out first. All free — the large sizes are not held back. Keep scrolling — the collection runs deeper than the first screen.
-

Chart showing investment returns for Russell 1000 and Responsible Index across different time periods. -

Minimalist abstract design with ascending dark gray curved bars on black background. -

Bar graph showing contrast between traditional to-do list and proactive planning. -

Colorful 3D bar chart showing upward growth trend with red arrow. -

Four glowing glass bars in green and blue gradient ascending in height. -

A blue horizontal line on a coordinate grid with labeled axes. -

Scientific graph displaying global and continental temperature anomaly trends from 1900 to 2000. -

Silver cordless phone on base with USA map behind -

Scientific chart displaying glacier mass balance decline across global regions from 1960 to 2000. -

Bar chart displaying average monthly rainfall in San Jose California. -

Digital magazine page with pixelated face and white text on black background. -

Pure black background with no visual elements. -

Energy system diagram showing consumer utility and deregulated energy company with data management labels. -

Black and white grid pattern with uniform squares and intersecting lines. -

Blank graph paper with grid lines and text at top -

Magnifying glass over financial charts and data sheets with green leaves. -

Black background with white grid and teal border lines -

Four vertical blocks with colored segments and labels for technical diagram. -

Bar graph displaying IELTS speaking topic preferences among students. -

Three vertical bars with green and purple sections labeled with mathematical notation. -

Bar graph displaying children's favorite sports including swimming soccer cricket skating and martial arts. -

Blue bar chart with upward arrow showing increasing values. -

Four yellow 3d figures assemble a rainbow puzzle toward a success sign. -

Line graph comparing straight and curved performance across categories. -

A minimalist red abstract shape on black background -

Green L-shaped line on black background -
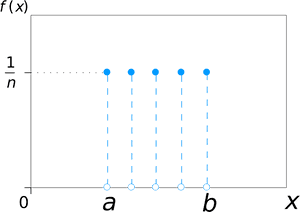
Five vertical blue dotted lines with glowing circles at top and bottom on black background. -

Geometric pattern of concentric circles and radial lines on black background -

Pure black background with no visible content or details. -

Teal and white geometric logo with hands and footprints around text STPEDE -

Bar chart showing 77% prefer customer photos 22% prefer professional photos -

Black and white icon of bar chart with upward trending line graph. -

A colorful icon network showing digital concepts and connections. -

Pie chart displaying U.S. adults' views on chiropractors treating neck and back pain. -

Orange pyramid showing three music-related foundation funds -

Medical eye scan with labeled parts and graphical data representations. -

Digital waveform graph with grid lines and colored vertical lines. -

A red and blue line graph showing upward trend with data points. -

Blue pixelated bell curve on black background representing statistical distribution. -

Street art collage showing economic inequality and social issues through symbolic imagery. -

Solid black background with no visible content. -

Smartphone showing audience analytics with location and age range bar charts. -

Teal Venn diagram illustrating business trade-offs between fast expensive good and cheap slow crappy. -

A person icon at the start of a red upward staircase representing advancement. -

Pure black background with no visible content or details. -

Scientific line chart displaying temperature data over 24 hours for greenhouse and ambient conditions. -

Magnifying glass examining data charts on computer and tablet screens. -

Bar chart comparing Google text ad CTR differences by device and page location in North America Q4 2016. -

Robot hand stacking coins with financial graphs in background. -

Robotic hand stacking gold coins over financial graphs. -

Robotic hand stacking coins with financial graphs in background. -

Live video feed showing a suburban neighborhood from above with user interface elements. -

Collection of 3d financial charts and graphs on black background. -

Downward arrow symbol indicating decrease or decline. -

A bar chart with five colored squares indicating levels of consideration from never considered to seriously considered. -

Six black circular grids on white squares in a grid pattern with black bars. -

Abstract pattern of white dots on black background in horizontal bands. -

Black background with faint white mathematical equations and symbols. -

Scientific graph showing data points labeled 1 to 61 forming a curved trend. -

Radial software package size breakdown chart with color-coded segments. - Next page
Showing 61–120 of 141 wallpapers
Frequently asked questions
Can I download these Graph PNG without signing up?
No payment is involved. Skip the sign-up; it is not needed. You get the clean original, not a preview.
What should I browse after Graph PNG?
Nearby collections: graphics design png, sketch png, figure png, curve png. They overlap in theme but not in content.
How many Graph PNG will I find here?
There are 141 Graph PNG on this page. Downloading costs nothing and needs no profile.
Which screen shapes do these Graph PNG suit?
Vertical and horizontal are both stocked. Count them and you get 45 wide and 15 tall. Grab whichever proportion suits the device in your hand.
Do these Graph PNG have transparent backgrounds?
Yes — every PNG here has a transparent background. Edge quality is checked before publishing. Place it in a layout without a white box appearing.