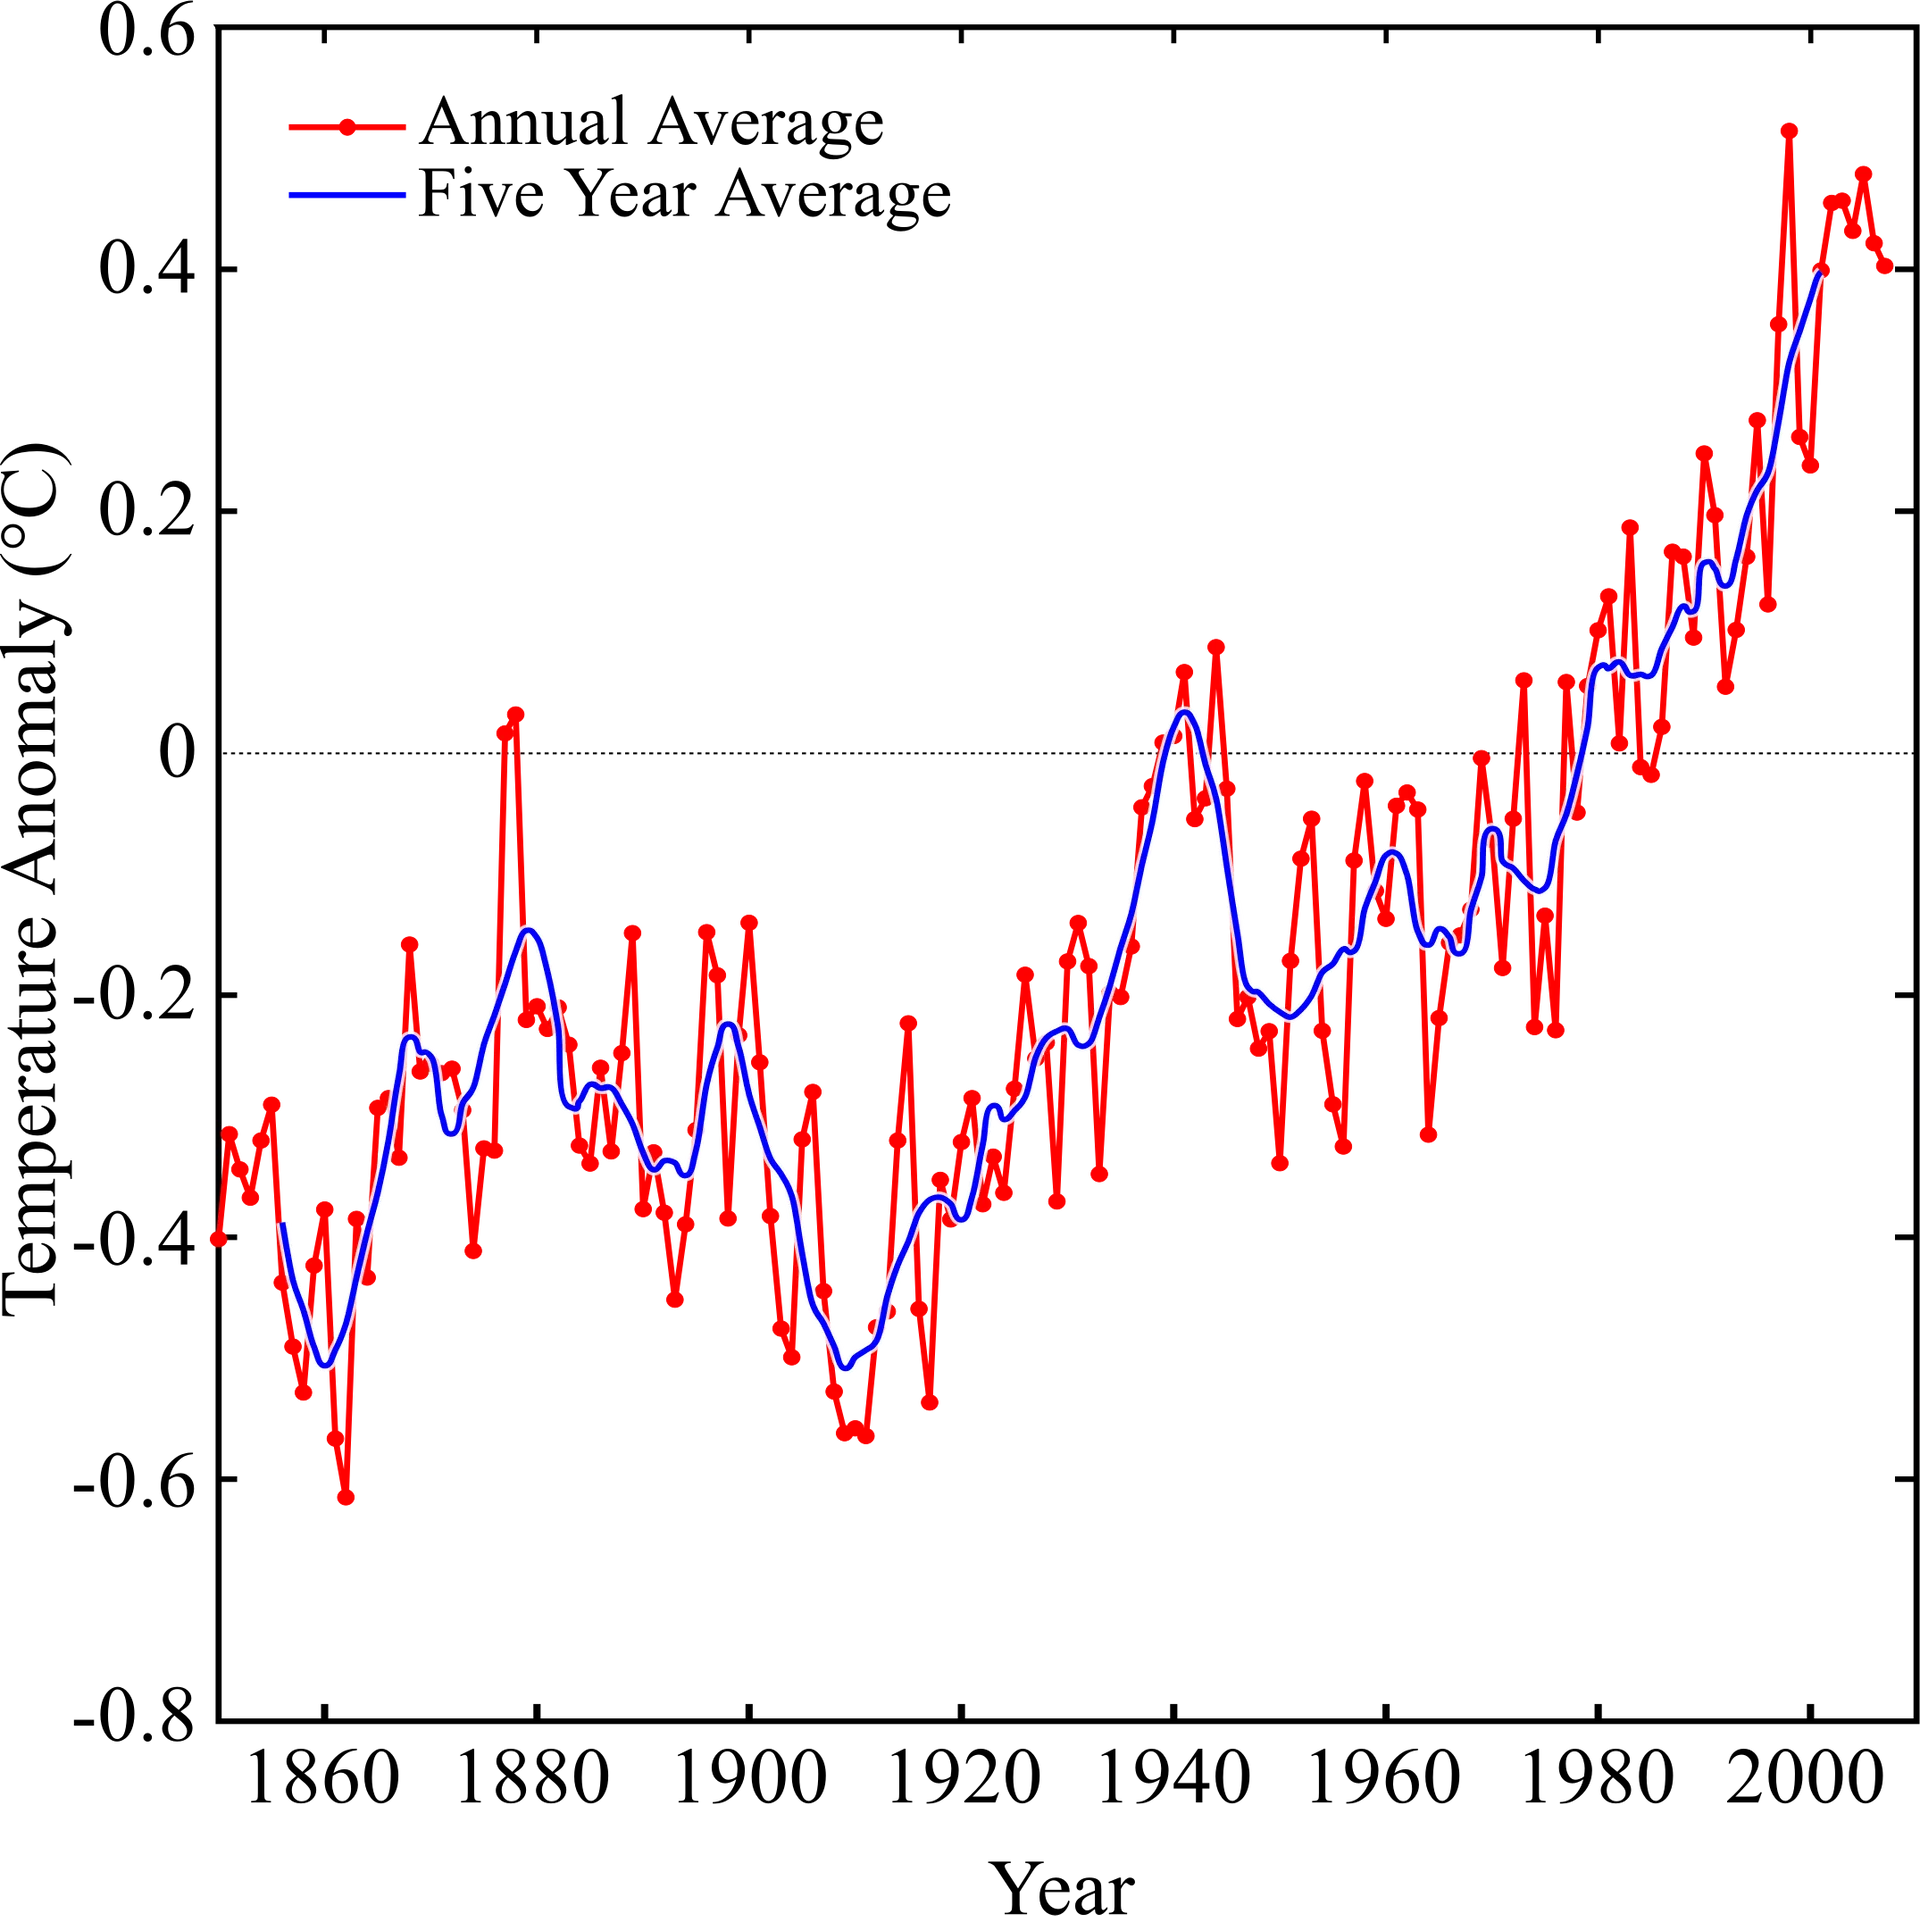
Historical Temperature Anomalies Graph PNG
A dynamic red and blue line graph with data points on a black background shows upward trends and fluctuations.

Edit Historical Temperature Anomalies Graph PNG
Browse all PNG tools ›


Related Historical Temperature Anomalies Graph PNG
-

Linkedin_ Logo_ Black_and_ White PNG -

Rising Bar Graph With Arrow PNG -
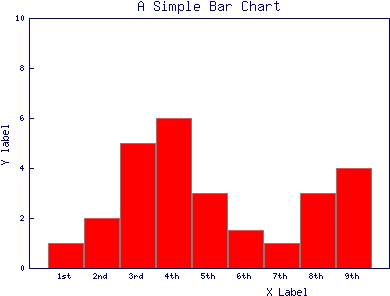
Simple Bar Chart Example PNG -

3 D Bar Chartwith Line Graph Progress PNG -

Colorful Graphsand Charts Collection PNG -

Declining Revenue Graph PNG -

Ascending Bar Graphwith Upward Arrow PNG -

Colorful Patterned Pie Charts PNG -

Ed Surge Graphofthe Week Presentation PNG -

Bar And Pie Chart Icon PNG -
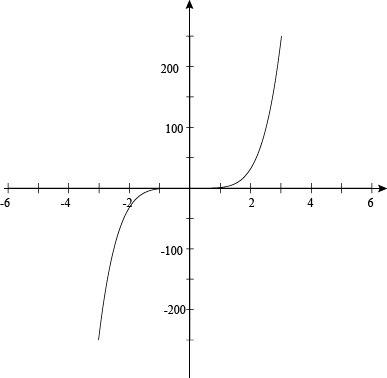
Exponential Function Graph PNG -

Polar Coordinate Grids Set PNG -

Dragon Breath Types Bar Chart PNG -

Monthly Performance Bar Chart PNG -

Social Media Live Video Screenshot PNG -

Sine Wave Graph Cartesian Coordinates PNG -

Bus Trip Passenger Count Graph PNG -

Graph Lattice Structures PNG -

Varietyof Stock Market Graphs PNG -

Financial Data Fluctuation Graph PNG -

Coordinate Plane Point A Graph PNG -

Abstract Colorful Network Graph PNG -

Downward Arrow Graph Icon PNG -

Multiline Graph Backend Performance PNG -

Clothing Exports19952005 PNG -

Pfizer Circleof Hell Infographic PNG -

Non Revenue Water1998 Q12014 Citywide Graph PNG -

Sine Wave Graph PNG -

Ascending Bar Graph Visualization PNG -

Trigonometric Function Tangent Graph PNG -

Mountain Peak Average Heights Comparison PNG -

Consumer Considerationfor Battery Powered Equipment Graph PNG -

Best Year Raw Votes Bar Chart PNG -

Spanning Graph Forest Representation PNG -

Customer Contactand Resolution Rate Graph PNG -

Quadratic Function Peak Graph PNG


📌 Boards
Build your own collection of png
Boards are free personal collections of wallpapers, backgrounds, PNGs and SVGs. Keep them private or share with one click.

