Chart Wallpapers | Page 2
Browse 438+ Chart Wallpapers to download free in HD & 4K
Download Chart Wallpapers for any device and screen size. High quality Chart Wallpapers and images! Customize your desktop, mobile phone and tablet with our wide variety of cool and interesting Chart Wallpapers in just a few clicks.

-
Digital stock chart with red and blue candlesticks overlaid on a glowing world map showing global market data. -

Close-up of glasses on a financial chart with red candlestick patterns and numerical data. -

Digital financial chart with glowing candlesticks and network nodes on blue grid -
Financial chart with red and blue lines showing weekly stock market trends. -
Digital financial charts display stock market data with green and red bars and lines on a dark blue grid. -

Roblox avatar wearing a top hat and chain next to game scenes rated best okay and bad. -
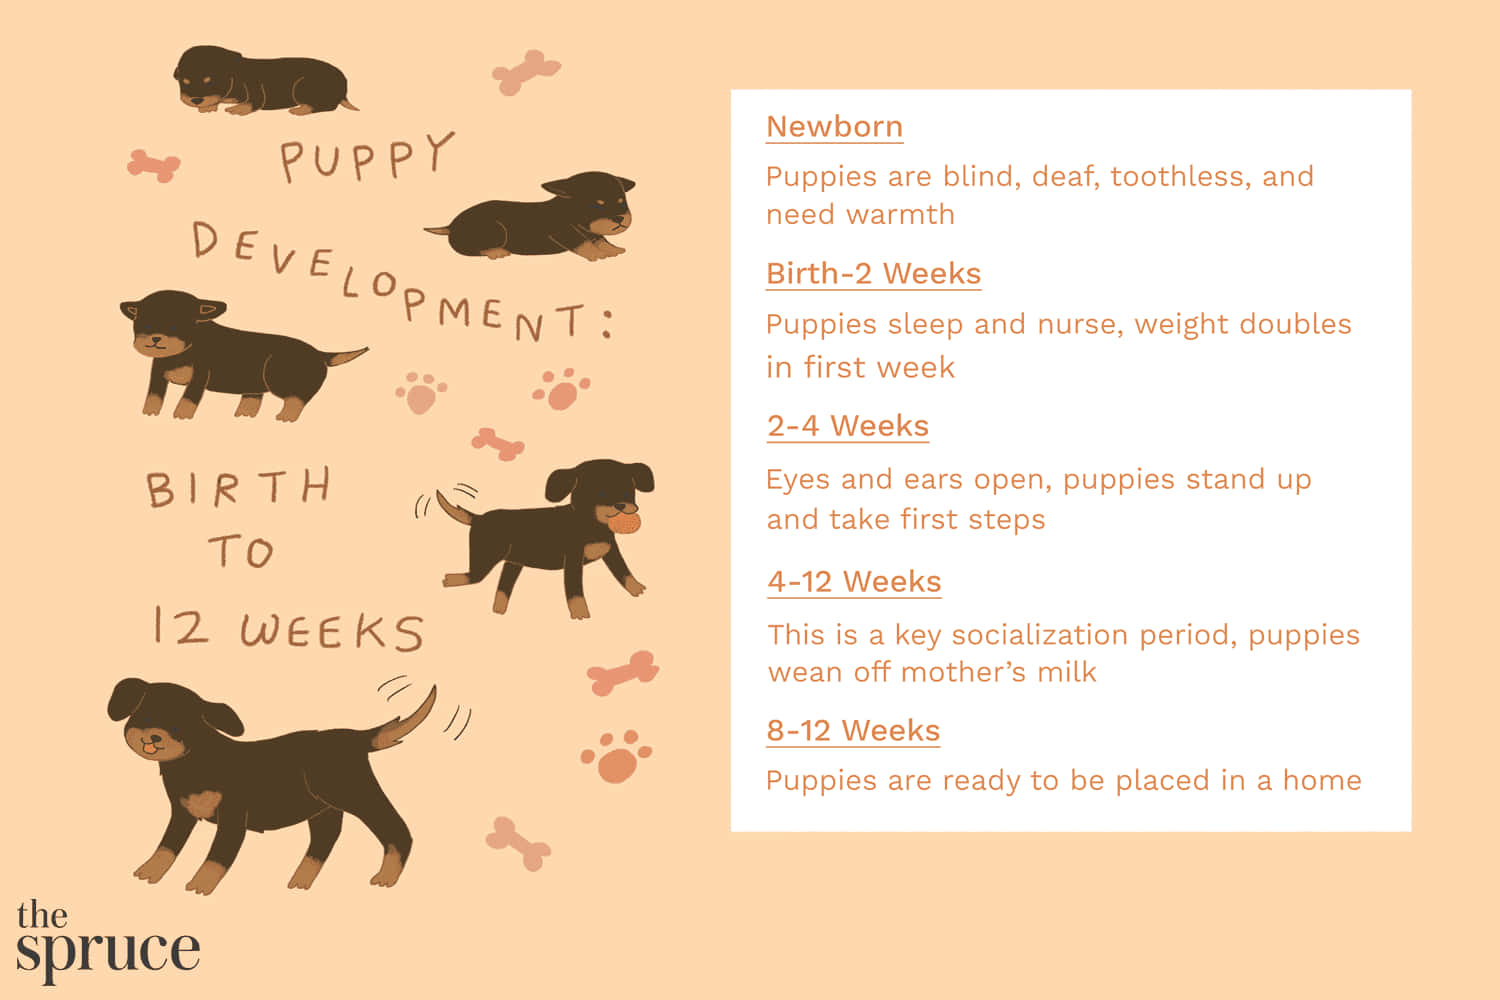
Infographic illustrating puppy development from birth to 12 weeks with cartoon dogs and text. -
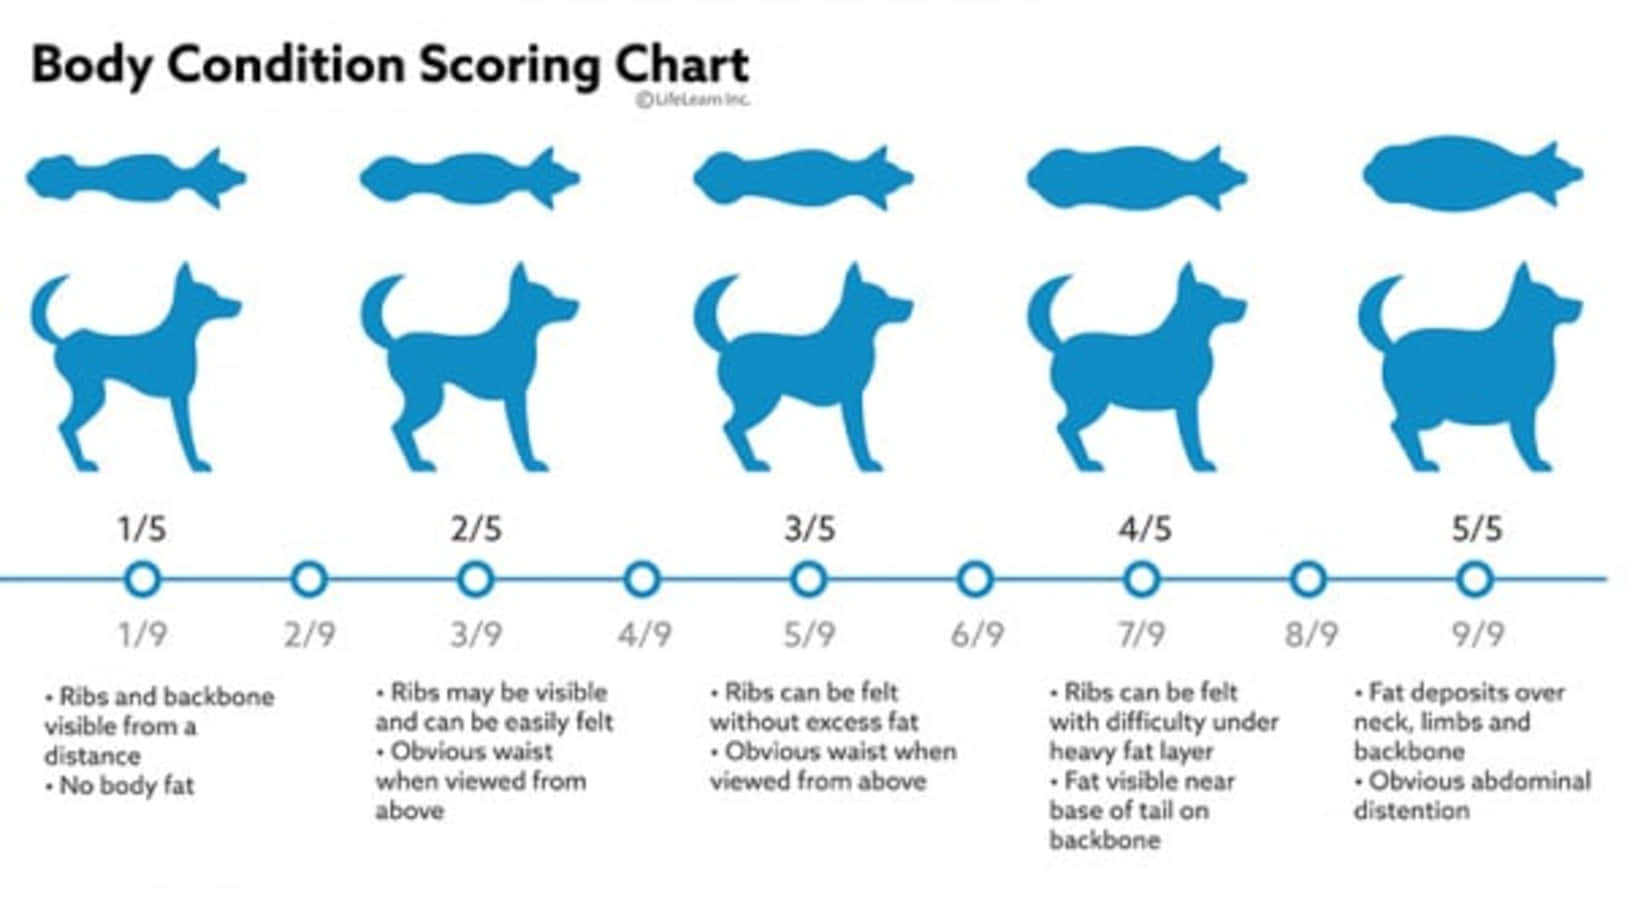
Blue dog body condition scoring chart with five stages from underweight to obese. -

Six moon phases from full to new displayed in grayscale against black background -

Pure black background with no visible content or details. -

Wedding figurine couple under floral arch with lanterns and rose petals -
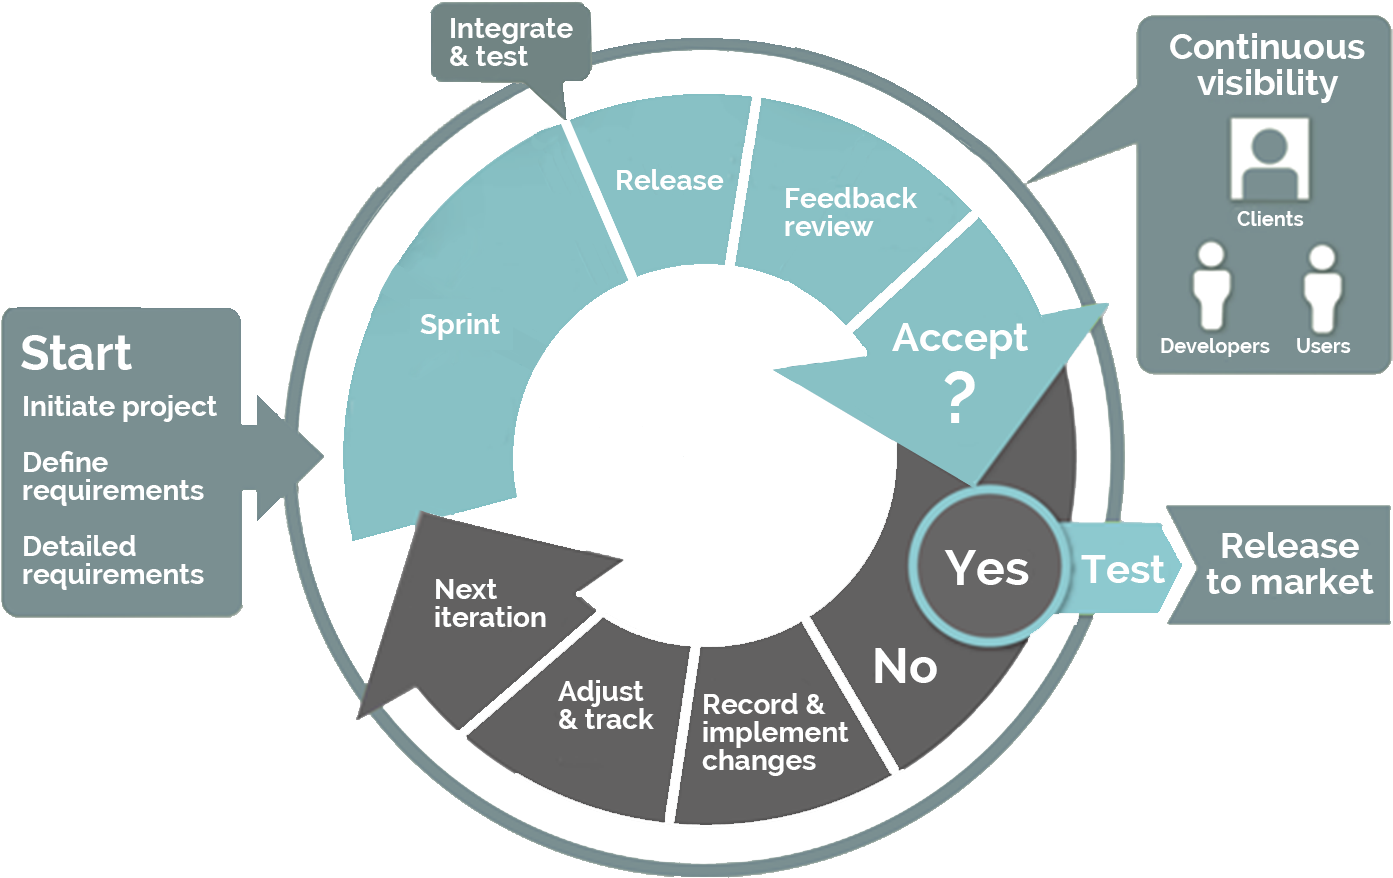
Salpo Agile Methodology workflow diagram showing iterative development and feedback loops. -

Circular diagram showing six stages of software development life cycle with colored segments and labels. -

Chart showing glacial periods with hot and cold labeled sections. -

Purple circular diagram illustrating a constructivist approach for lifelong learning with four phases -

A leadership pyramid with three levels labeled empower encourage lead teach -
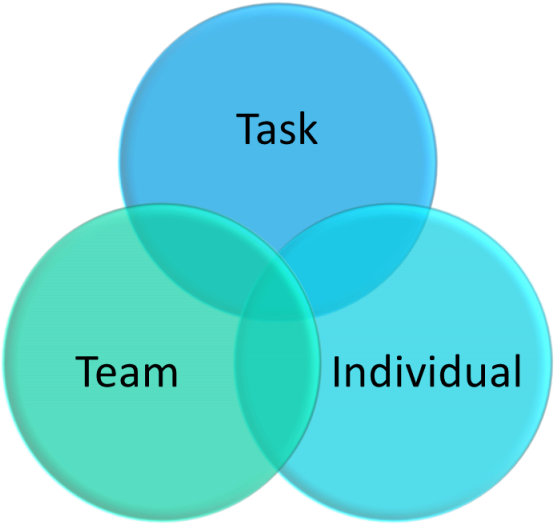
Venn diagram showing overlap between Team Task and Individual elements in blue and teal circles. -

Diagram of an eight-phase design process with feedback loops and central web structure. -

Scientific gene interaction network diagram centered on MYC gene -
Abstract digital art with blue rectangles on black background -

Five-step circular data analysis process diagram with icons and labels -
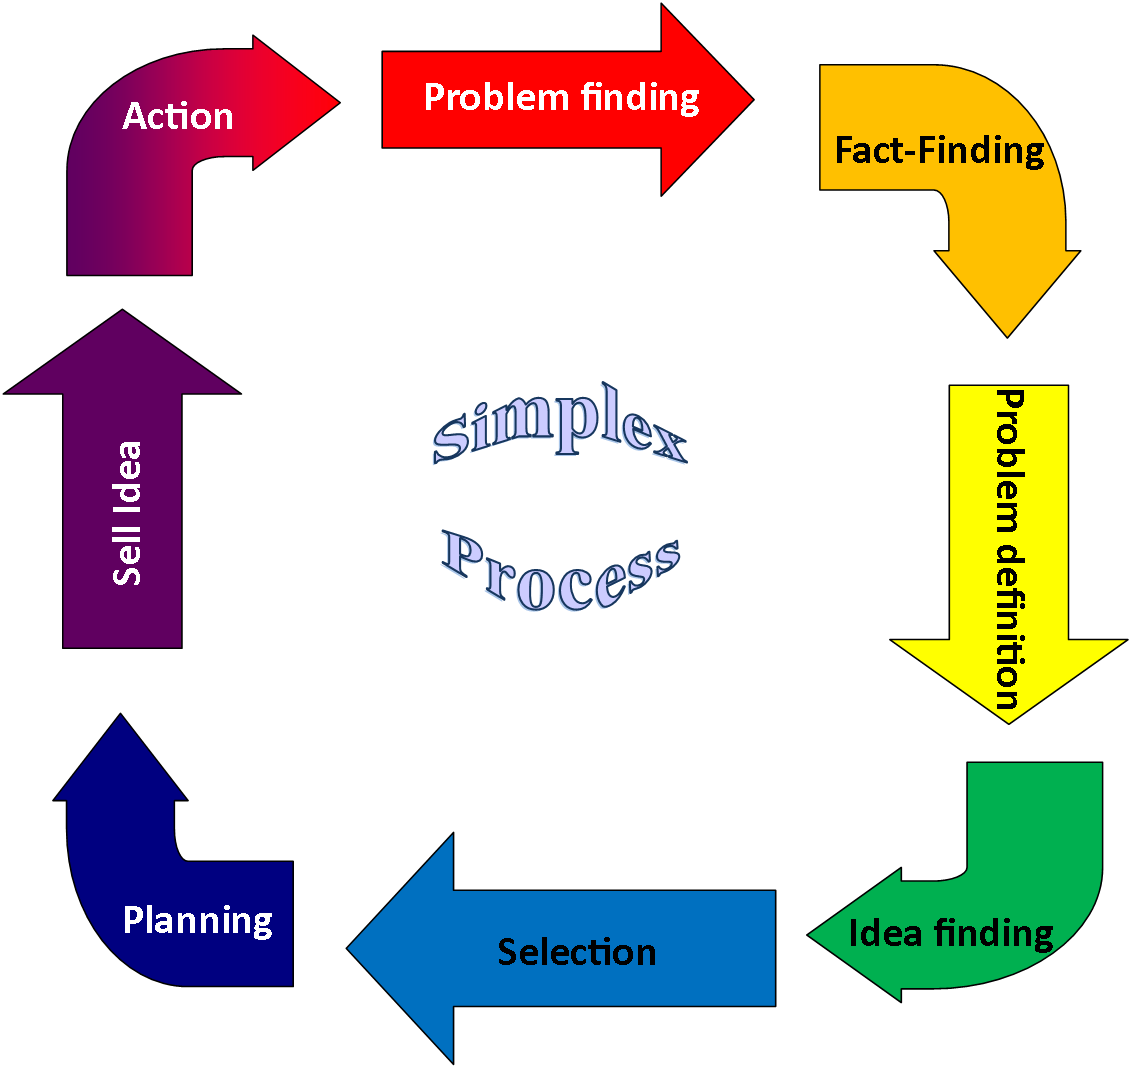
Circular diagram showing the Simples Process with labeled arrows for problem and idea finding planning and selection. -

Circular problem solving diagram with labeled puzzle pieces for Identify Define Explore Action Look back. -

A red and blue line graph showing upward financial trend on black background -

3d pie chart with Belarus flag colors and traditional pattern on one slice -

Bar chart comparing Google text ad CTR benchmarks in North America Q4 2016 -

Digital analytics dashboard showing demographic data across devices with green charts and user icons -

Advertising account structure diagram with campaigns ad groups keywords and ads -

Three colored panels showing advertising workflow: campaigns budget optimization with icons and bullet points. -

Digital network showing server connecting to web browser phone globe and user icons -
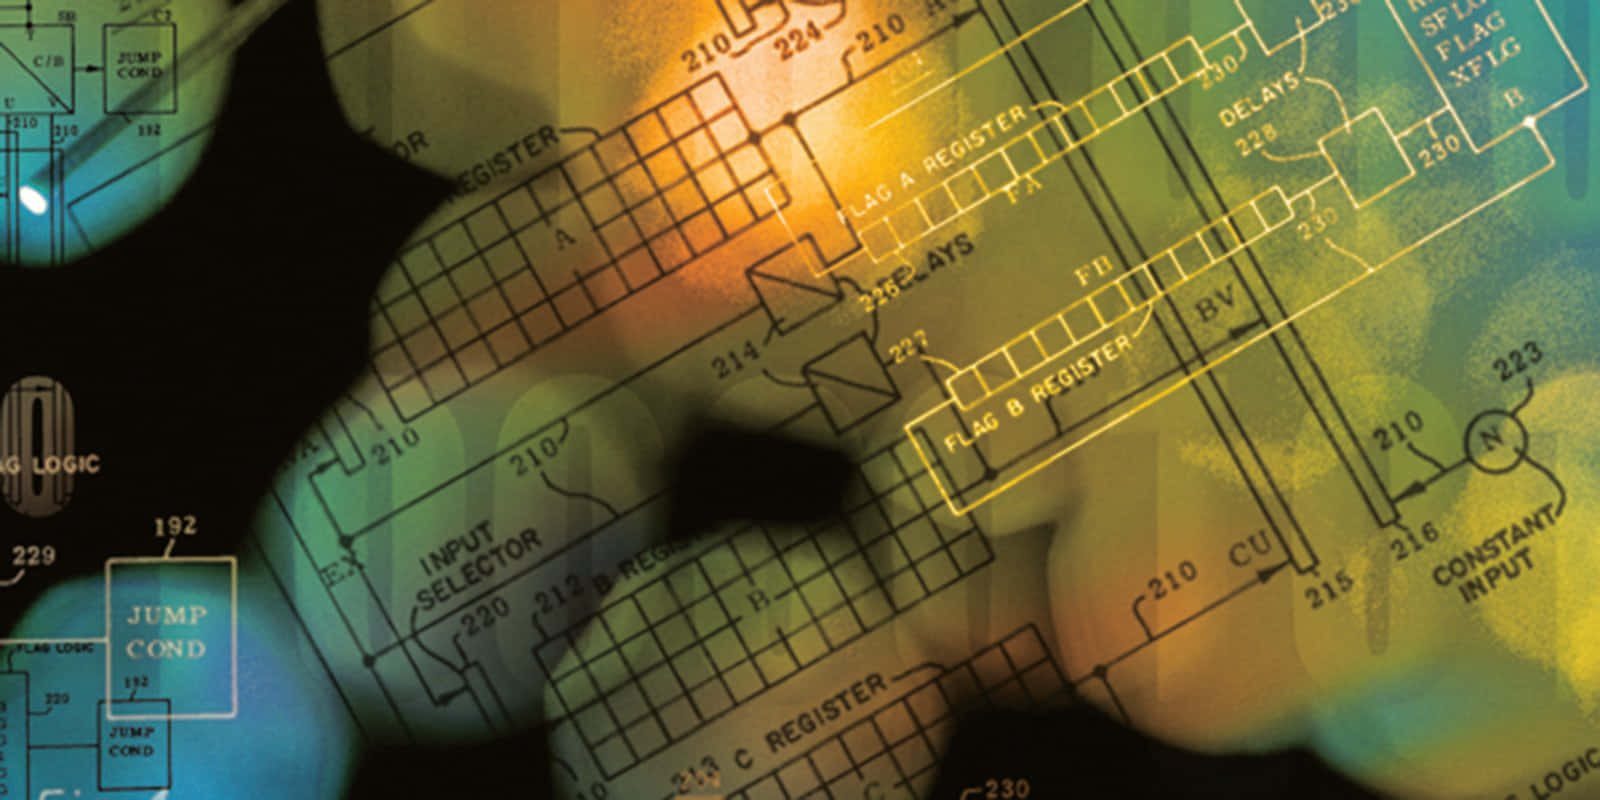
Glowing circuit diagram with blurred human silhouette against warm gradient background -

A detailed financial chart showing stock market data with colorful candlesticks and trend lines. -

A glowing network diagram with labeled nodes and pipes on a blue background. -

Futuristic glowing 3d bar chart with colorful translucent bars showing percentages and numbers on a dark background. -

A colorful digital bar chart showing data trends for May 2023. -

Educational flash progress chart with colorful blocks and text icons -

Symmetrical abstract art with glowing colored rectangles arranged in a radial pattern. -

Six glowing vertical bars with upward arrows and numbers showing growth in a gradient background. -

Digital wildlife population dashboard with glowing red and blue charts and icons. -

Futuristic glowing blue digital interface with abstract text and symbols -

A glowing green 3d world map on dark blue background -

Glitchy digital screens with abstract data streams and distorted UI elements in neon colors -

Digital screen showing a rainbow graph and two world maps with color-coded data. -

Glowing blue world map with red borders and starburst lights -

Circular infographic showing various tropical fish and coral species in segmented panels. -

Infographic displaying marine biodiversity with labeled fish and coral scenes in circular and rectangular panels. -

Three apartment buildings with colorful roofs next to a rising 3d bar graph on a grid. -

Digital stock trading wall with colorful financial data and charts -
White surface with a fine gray grid pattern of evenly spaced squares -

A glowing blue 3d bar chart with white neon numbers and labels. -

Futuristic glowing pie charts showing data percentages on a gradient teal background. -

A glowing digital interface with colorful buttons and distorted text on a gradient background. -

A colorful 3d bar chart with rainbow hues on a dark background. -

A computer screen showing multiple financial dashboards with garbled text and colorful charts. -

A vibrant digital dashboard filled with glowing charts and unreadable text in neon colors. -

Futuristic glowing bar chart with red and blue bars displaying numbers and symbols. -

Red spiral notebook with colorful vertical bars and scattered colored squares on graph paper. -

Neon glowing bar and line chart with abstract data visualization on gradient background -

Abstract digital bar and line chart with glitch effects on blue gradient background -
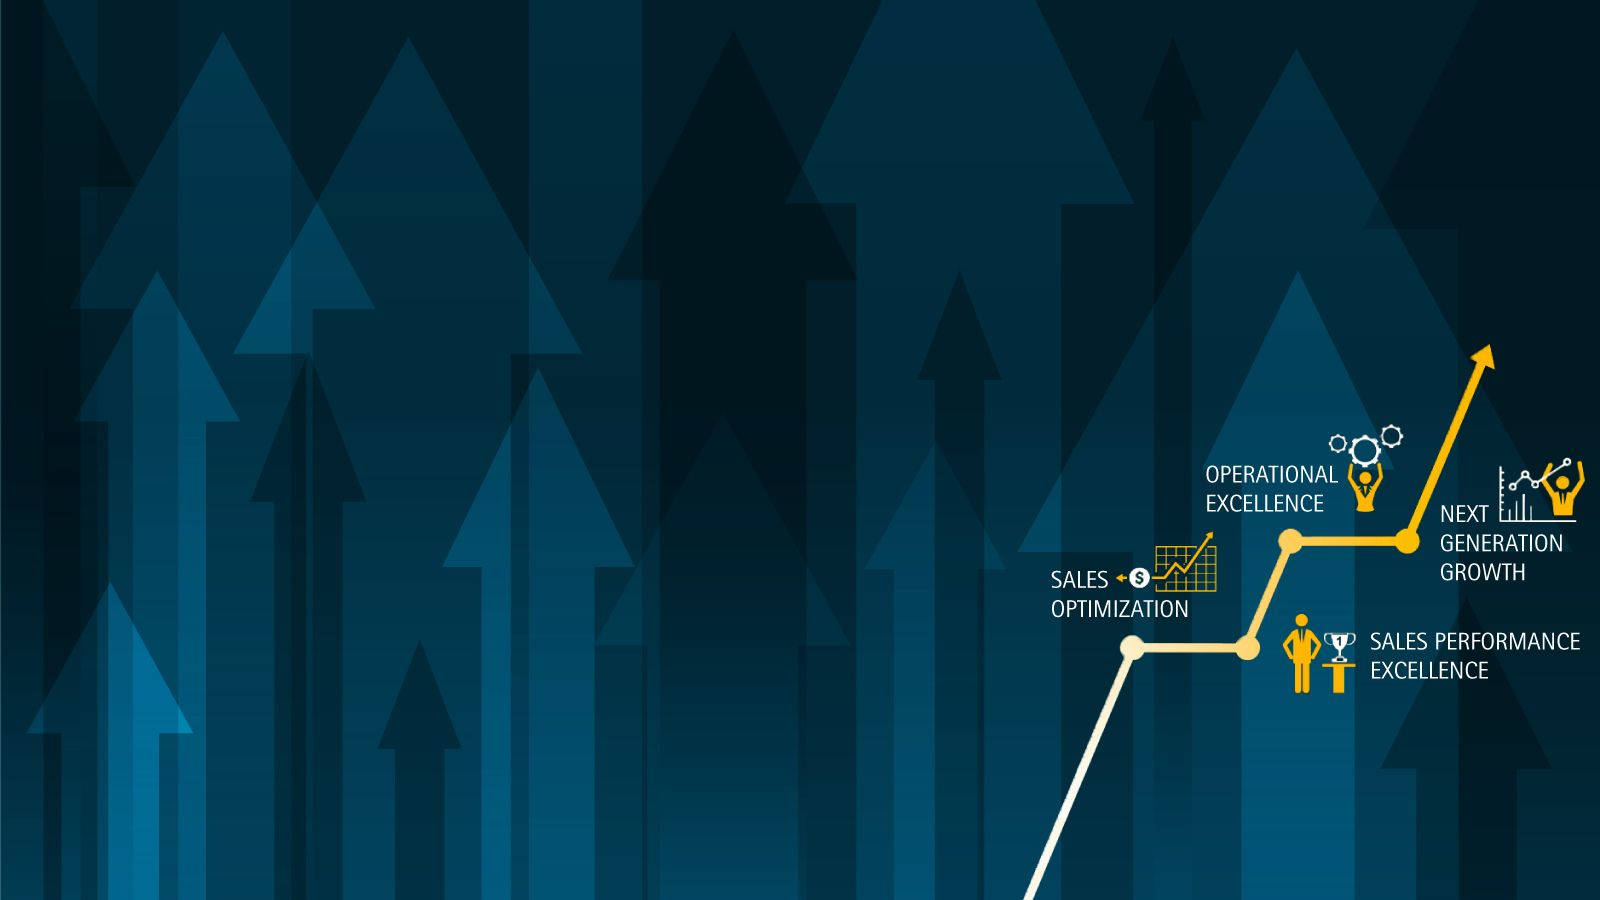
Business growth path with milestones and upward arrows on a blue background. - Next page
Showing 61–120 of 438 wallpapers