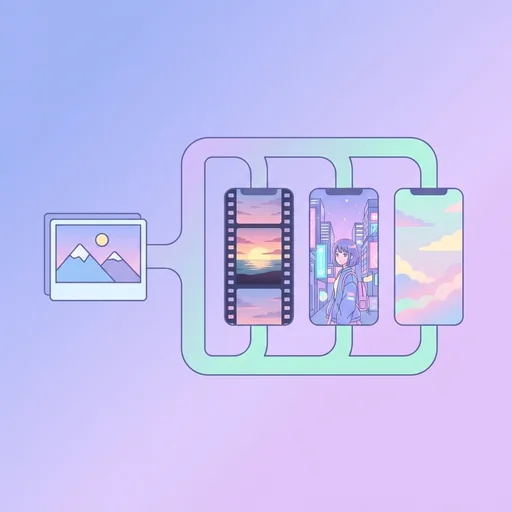
Visualization of a Cumulative Relative Frequency Graph Wallpaper
Three line graphs showing cumulative relative frequency by compression ratio for nine images over time.


Edit Visualization of a Cumulative Relative Frequency Graph Wallpaper
Browse all Wallpaper tools ›


Related Visualization of a Cumulative Relative Frequency Graph Wallpapers
-
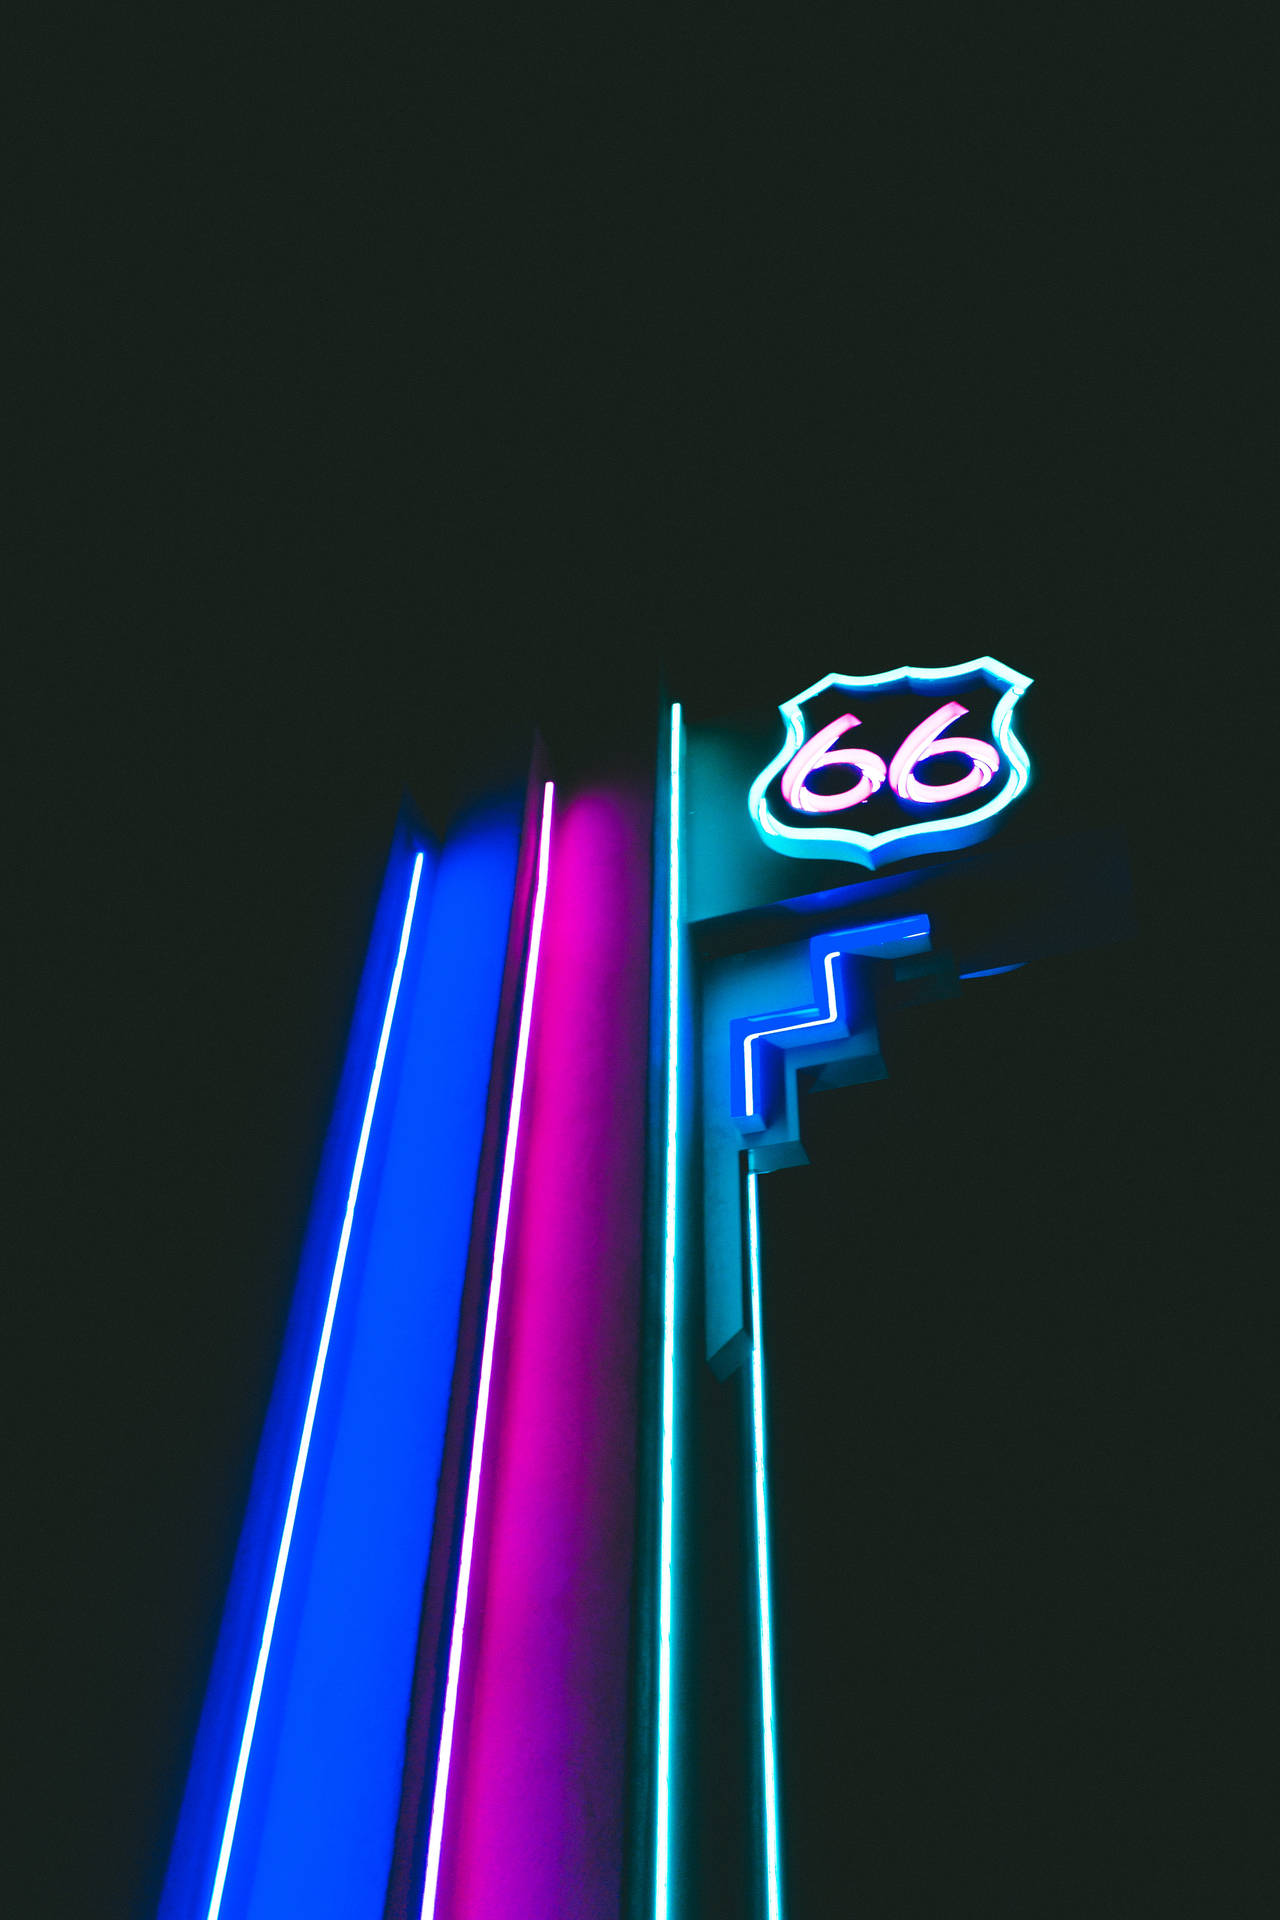
Neon 66 Board Wallpaper -
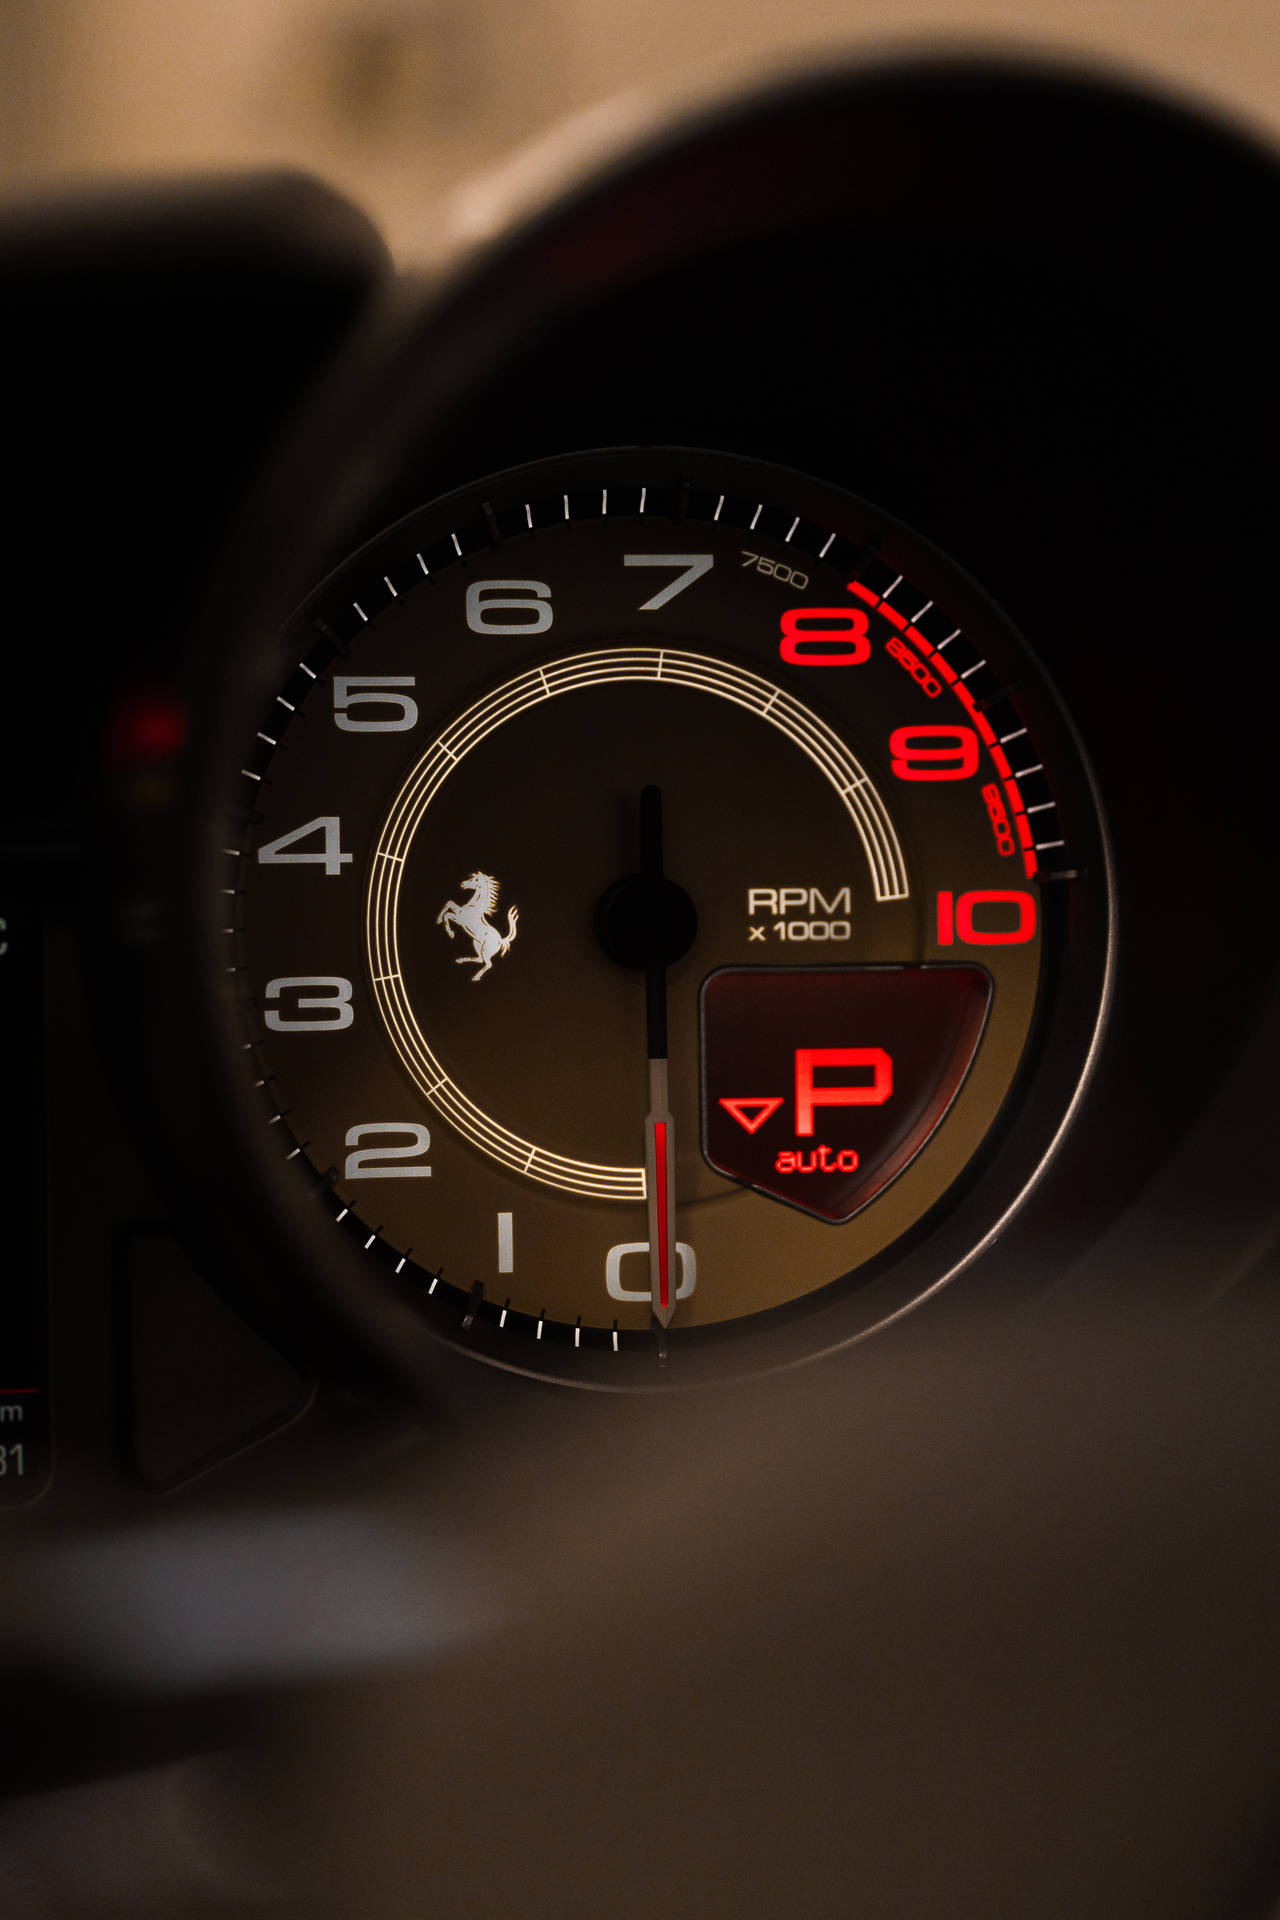
Porsche Speedometer Wallpaper -

Black And White Office Desk Desktop Wallpaper -
Technology in Its Purest Form Wallpaper -

Enjoy Longer Battery Life With Tablet Wallpaper -

Faded Font No Signage Wallpaper -

HD Engineering Numbers And Abstract Patterns Wallpaper -
Neon Orange Aesthetic 100 Wallpaper -
Neon Orange Aesthetic 0.430213 Wallpaper -
Happy Teachers' Day 123 ABC Wallpaper -

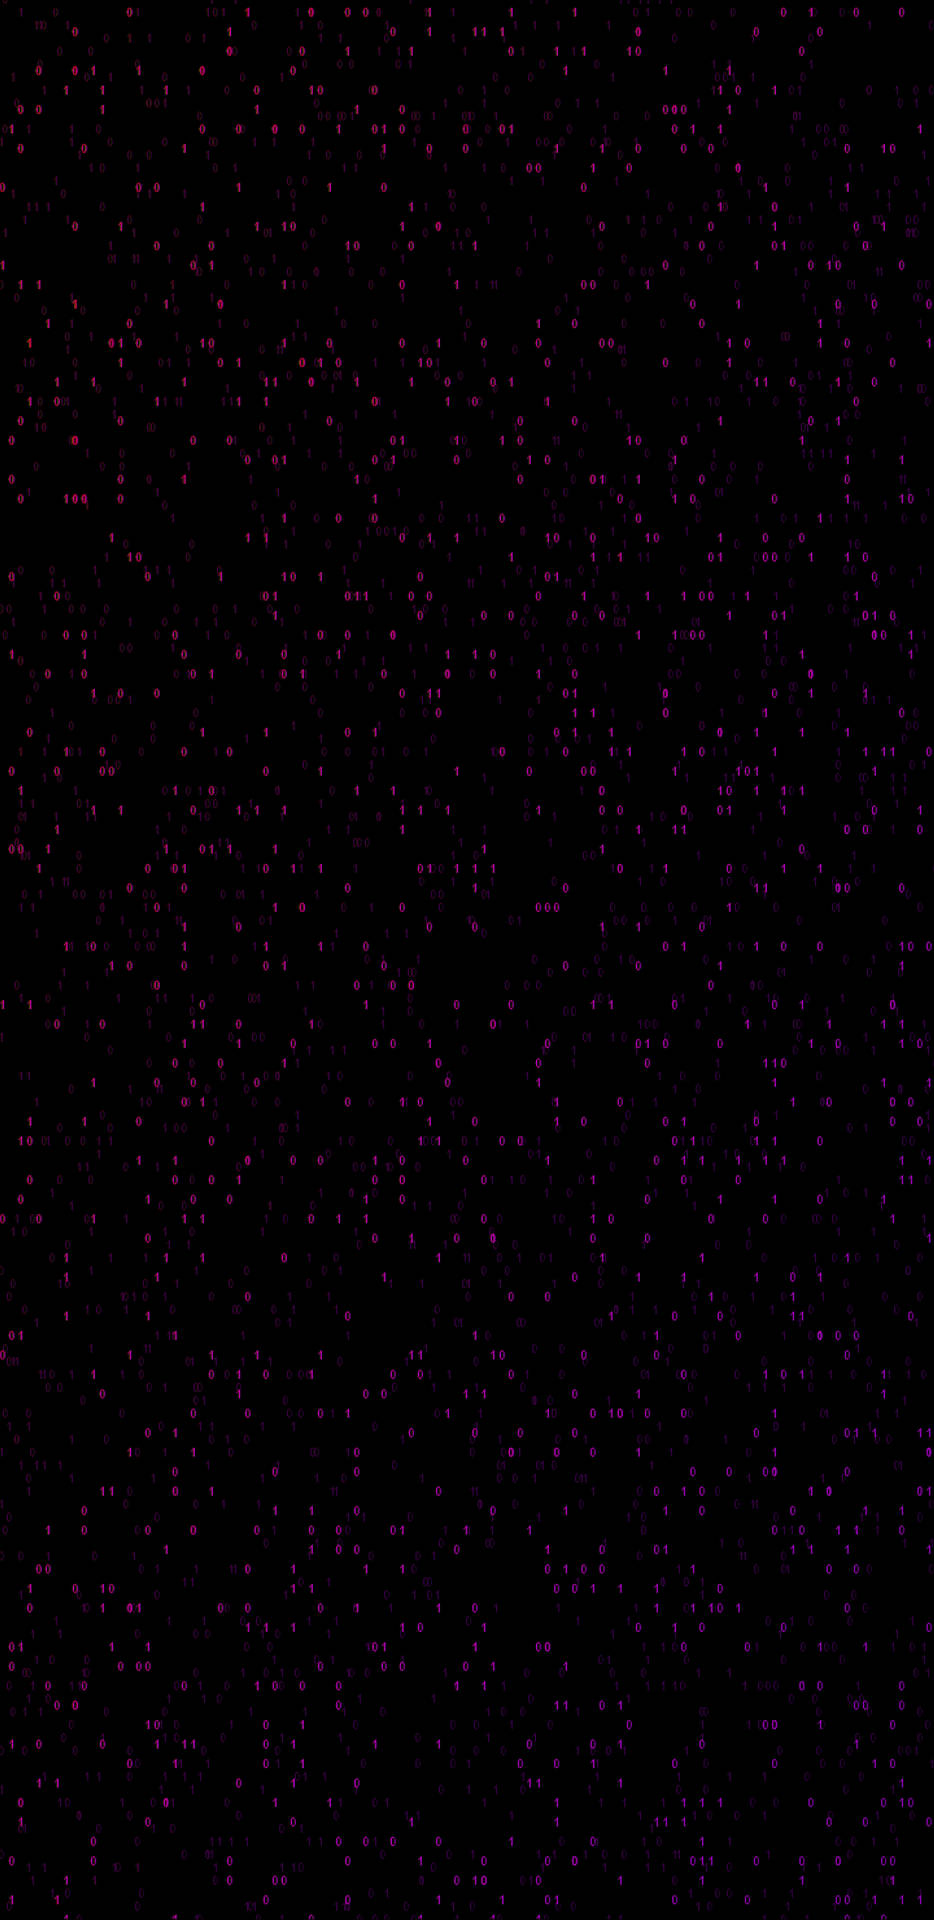
Binary Number Codes Rainmeter Design Wallpaper -
Numbers 8K Phone Wallpaper -
4K Ultra HD Dark Barcodes Wallpaper -

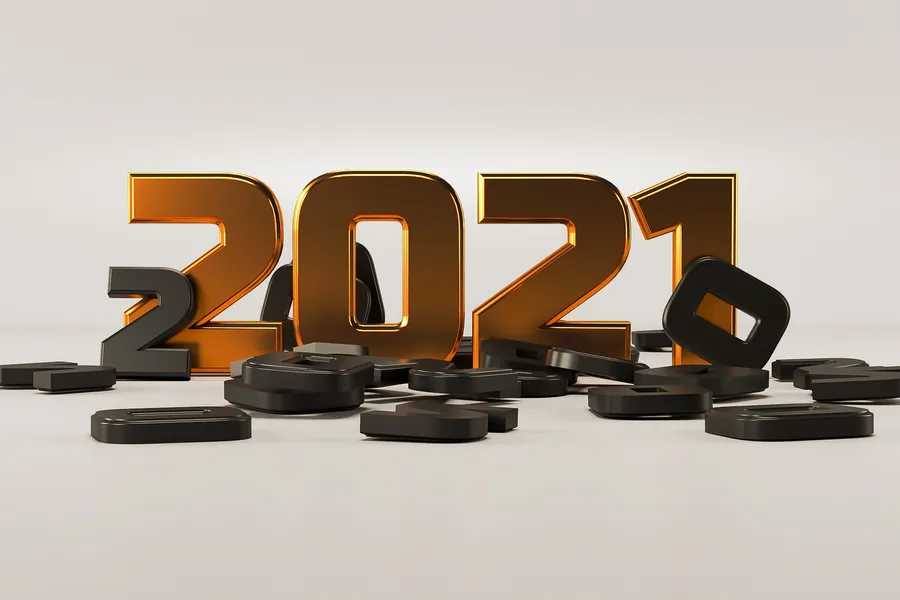
3D 2021 Desktop Wallpaper -

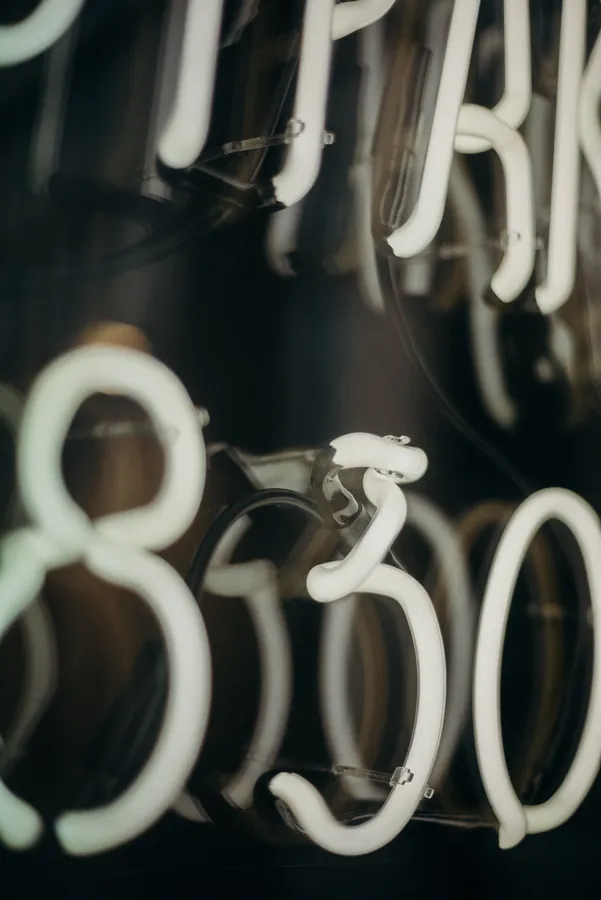
White Neon Aesthetic Numbers Wallpaper -

Windows 8 Splashing Background Wallpaper -

Keenan Allen Jersey 13 Wallpaper -
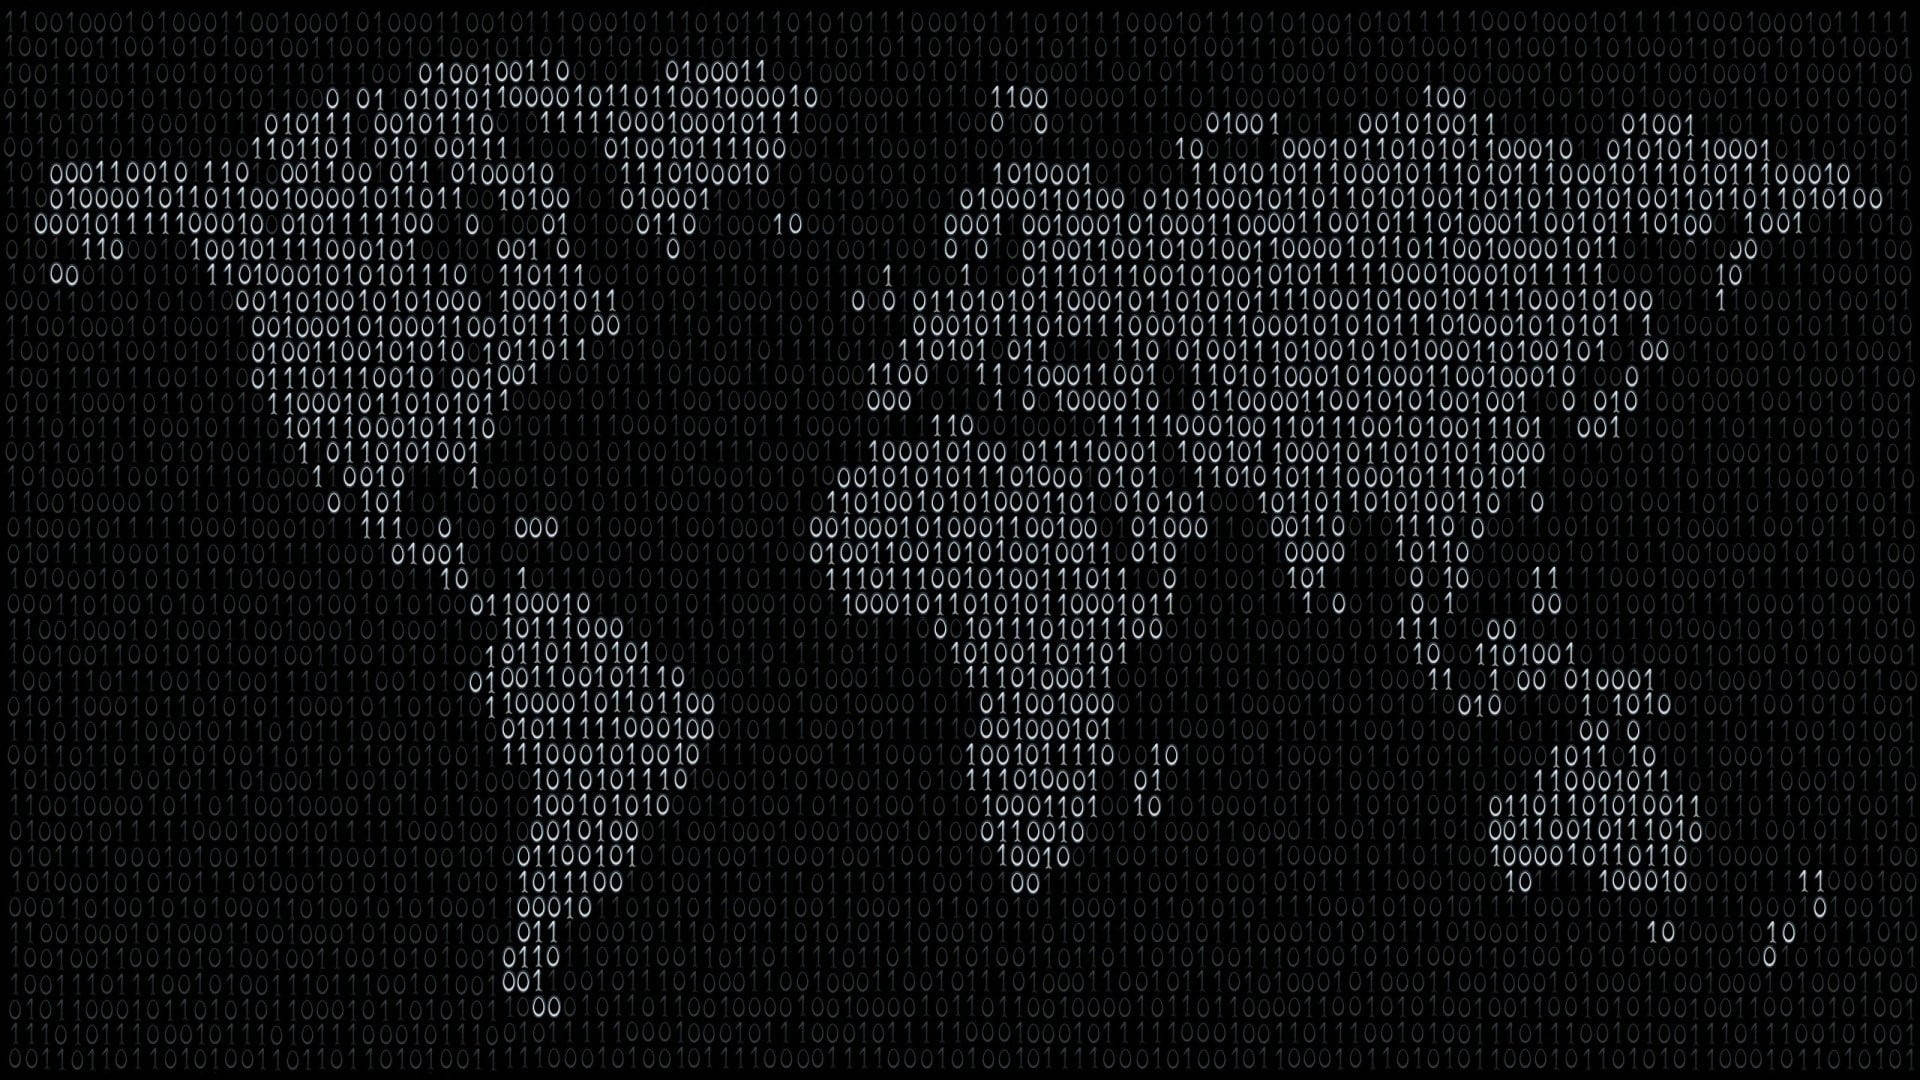
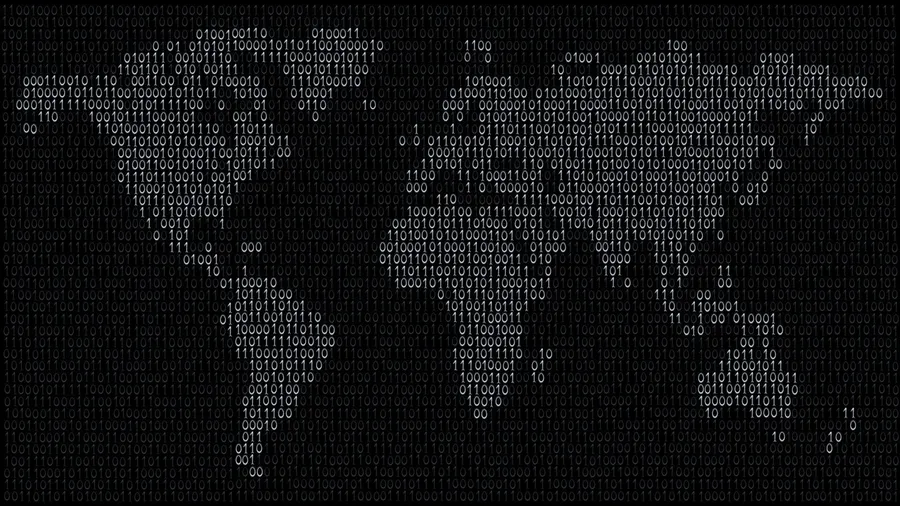
High Resolution World Map Digit Mosaic Wallpaper -

Sales Mobile Graph Wallpaper -

Rising Blue Stock Wallpaper -

Billiards Balls In A Row Wallpaper -
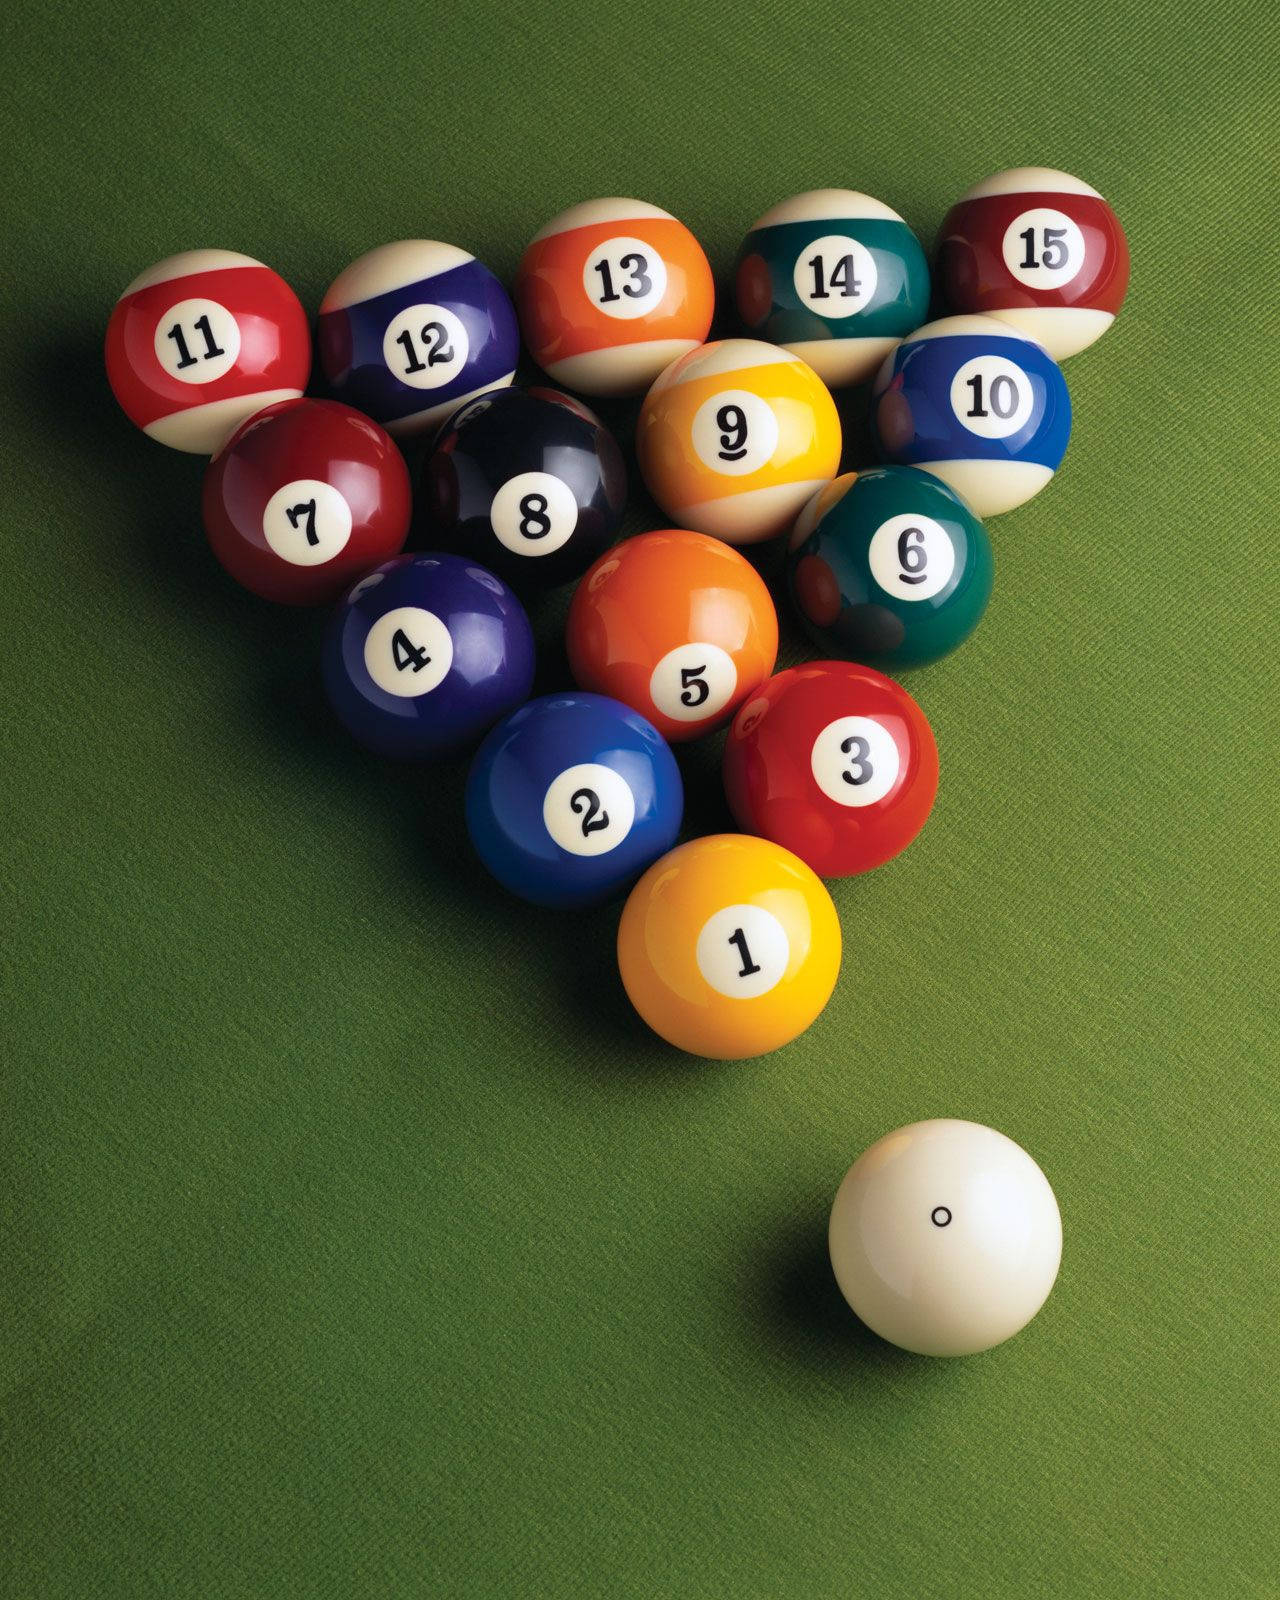
Billiards Balls In Triangle Formation Wallpaper -
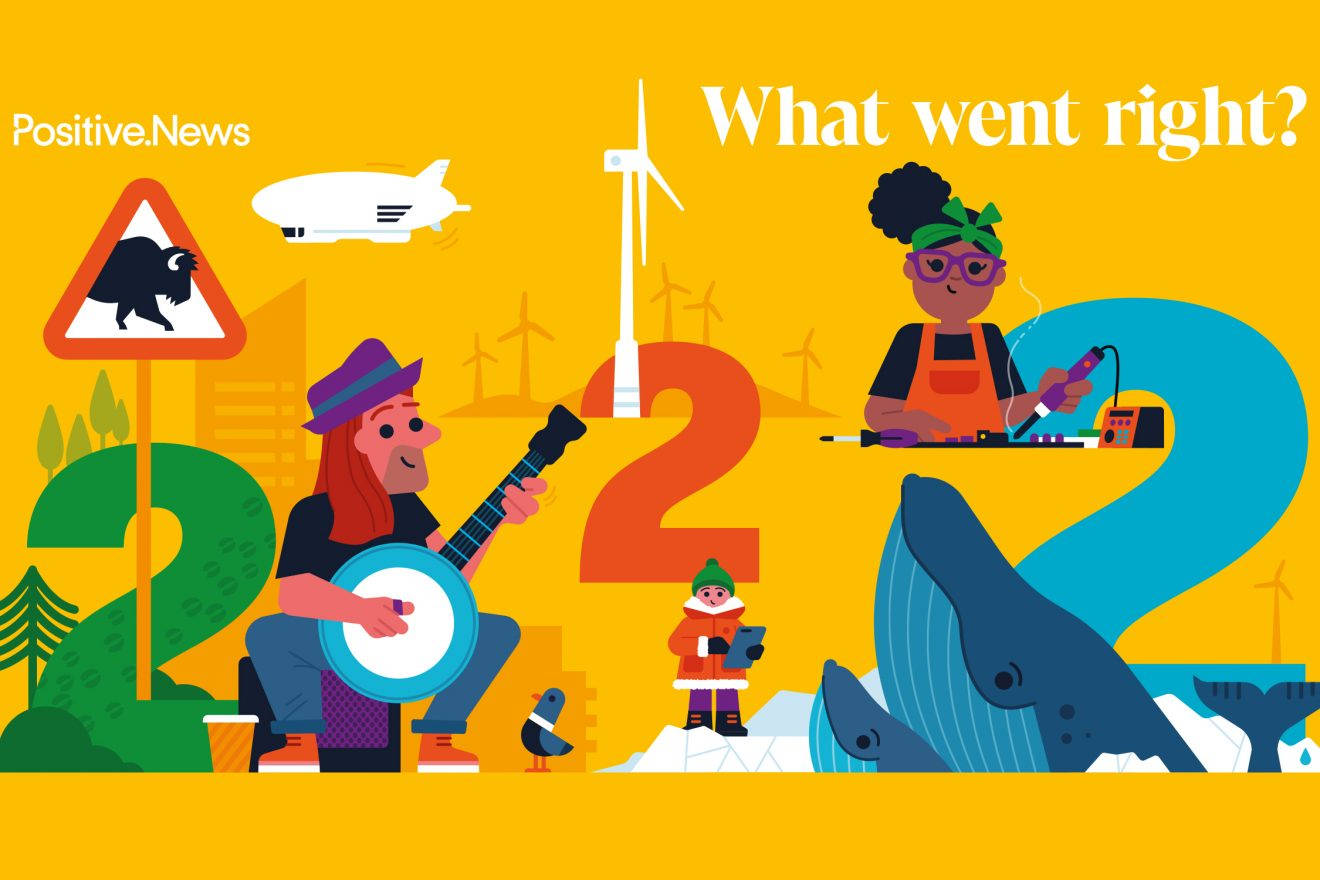
Digital Technology Conference 2022 Showcasing Innovations Wallpaper -

Storage Data And Information Wallpaper -

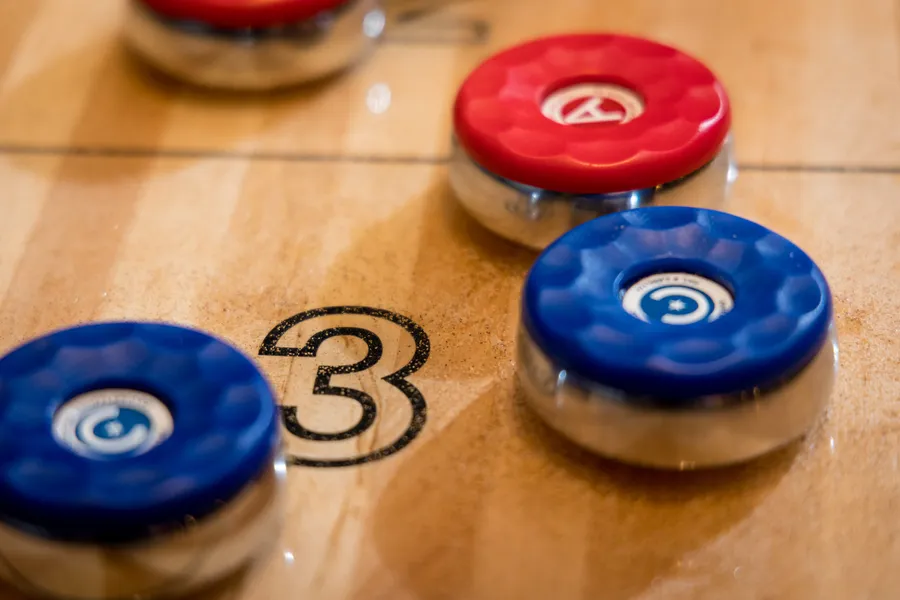
Competing in Shuffleboard - a close-up shot of a number three scoring puck. Wallpaper -
House Owned By Zillow Wallpaper -

Swing Stages Of Adam Scott Wallpaper -
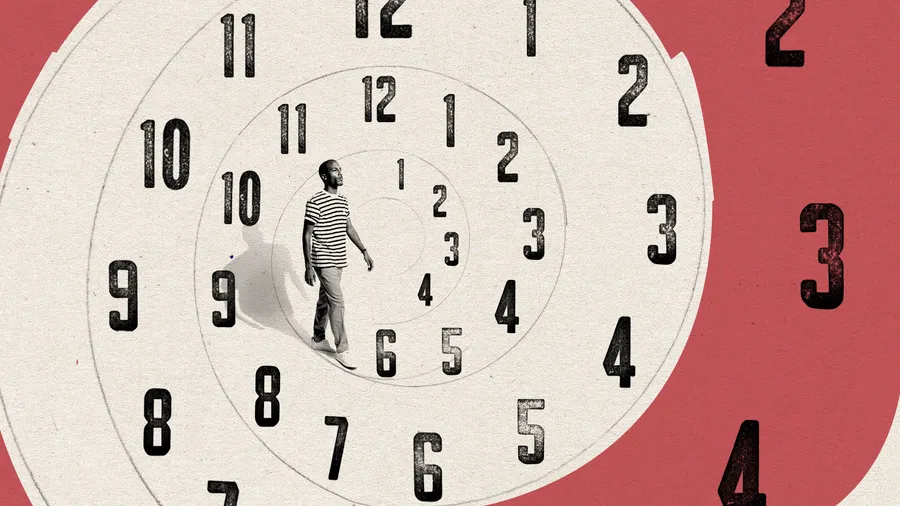
Time Spiral Wallpaper -

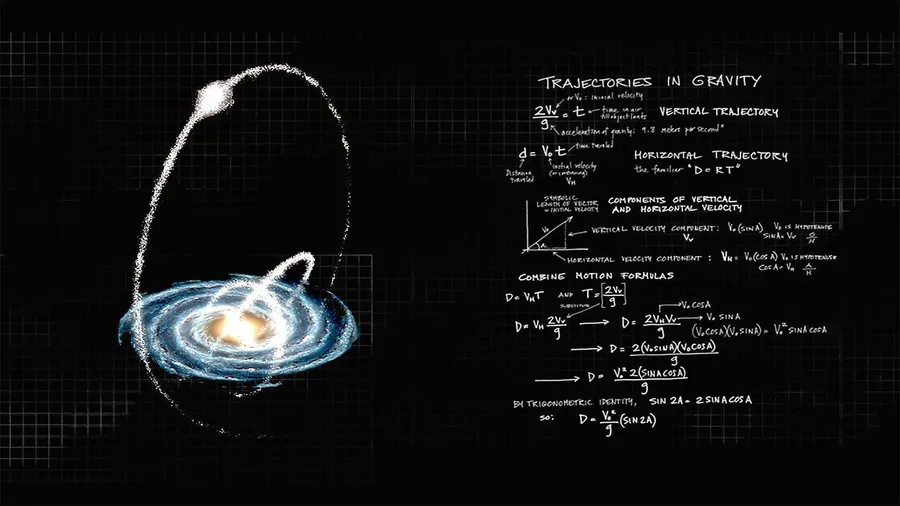
Mathematics Interconnected Equations Wallpaper -
Mathematics Colorful Equations Art Wallpaper -

Mathematics Numbers And Formulas Wallpaper -

Mathematics And Science Calculation Wallpaper -

Mathematics Written Equations And Numbers Wallpaper -

Mathematics And Boy In Blue Wallpaper -

Mathematics Equation And Diagram Wallpaper -

Mathematics Numbers On Black Cubes Wallpaper


📌 Boards
Build your own collection of wallpapers
Boards are free personal collections of wallpapers, backgrounds, PNGs and SVGs. Keep them private or share with one click.


